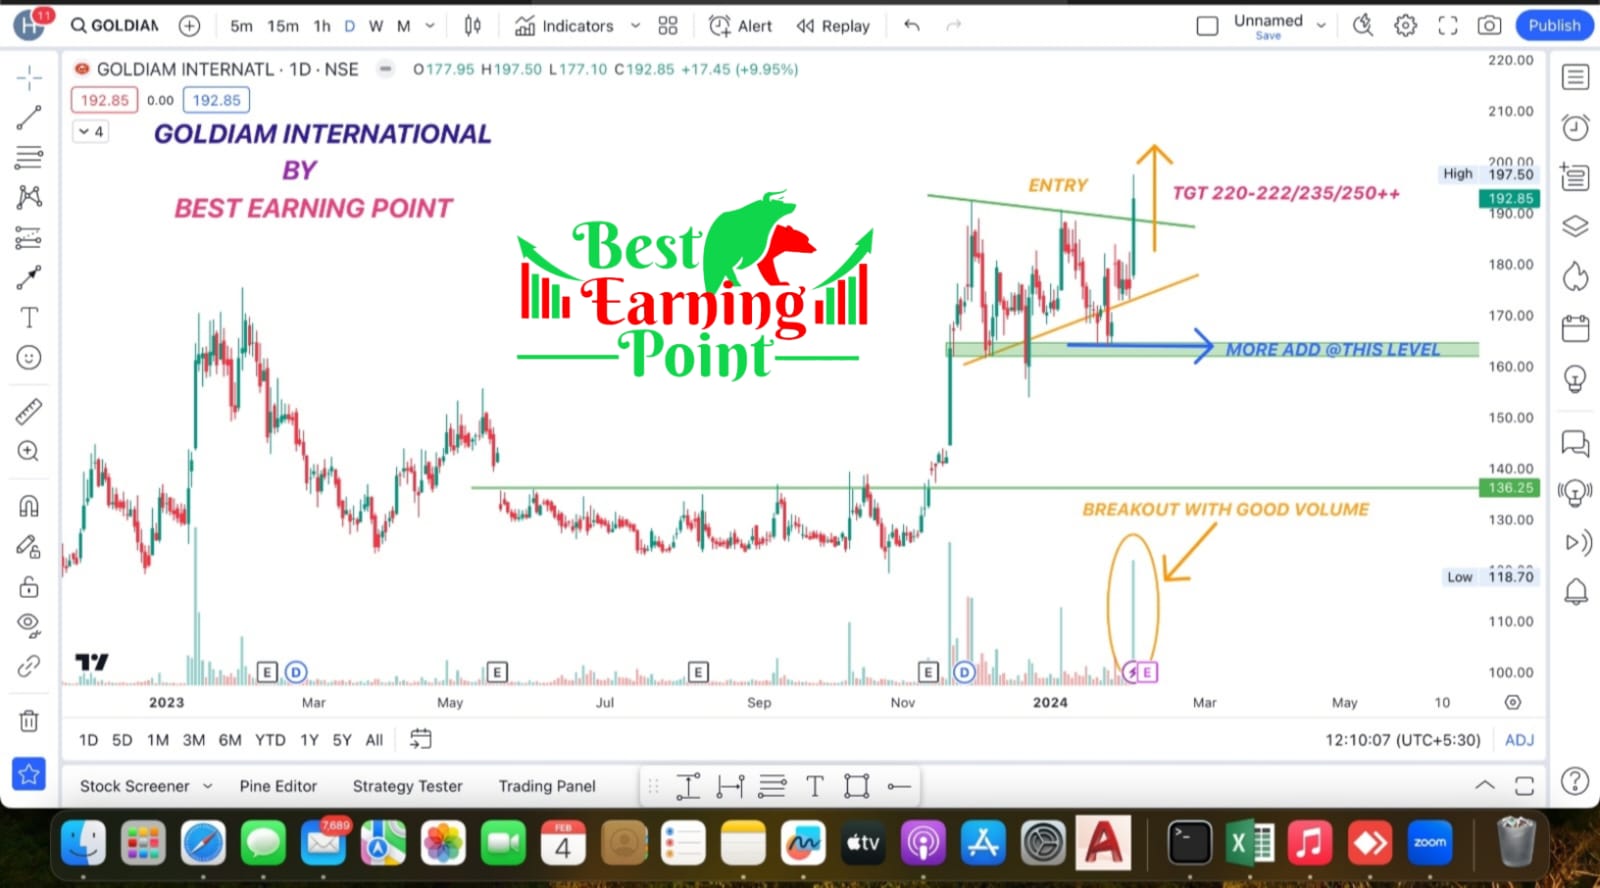
GOLDIAM INTERNATIONAL HAS GIVEN VERY GOOD BREAKOUT & VOLUME IS ALSO VERY GOOD.
GOLDIAM INTERNATIONAL SHARE PRICE CHART
3 thoughts on “GOLDIAM INTERNATIONAL SHARE PRICE CHART”
Leave a Reply
Related Post

Havells India Ltd NSE: HAVELLSHavells India Ltd NSE: HAVELLS
Friends Havells India हमने हमारे WhatsApp Group में 1350 के लेवल पर खरीदारी के लिए दिया था जो अब 1350 से 1590 का हाई बना चुका है। 1500 इसका बड़ा
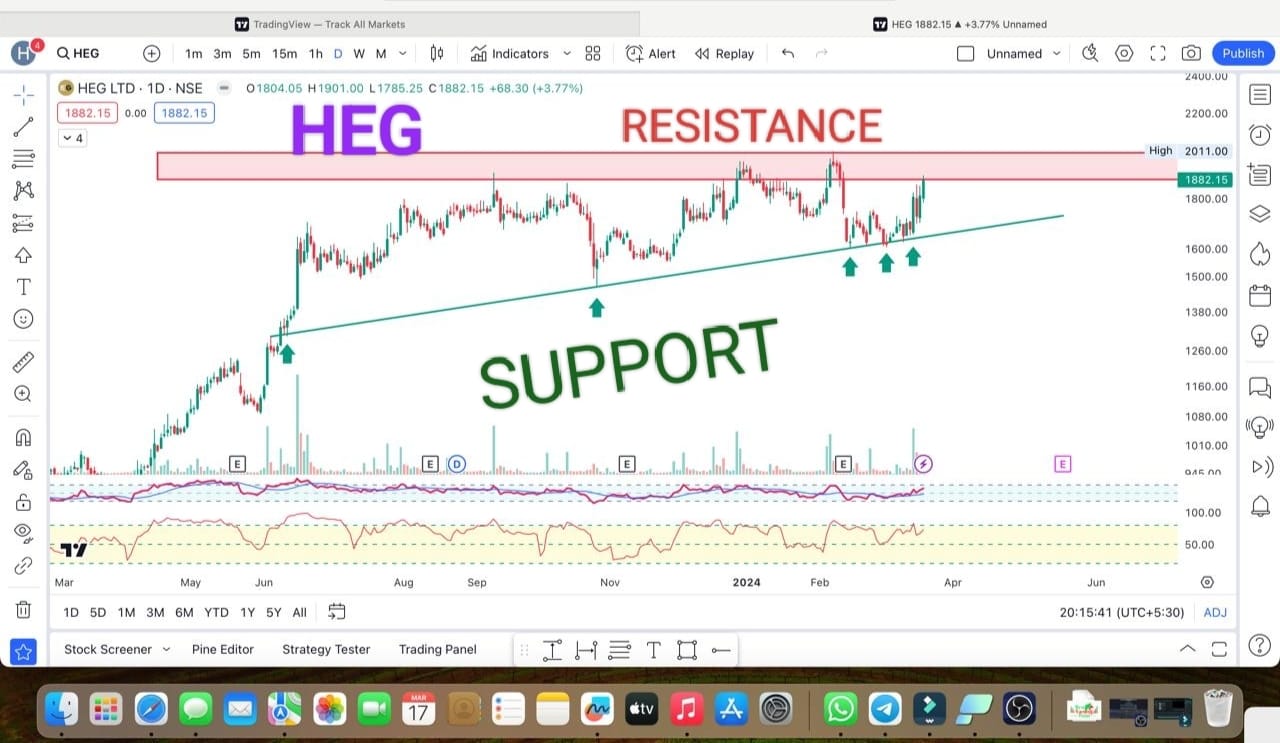
HEG LTD share price target 2024HEG LTD share price target 2024
HEG LTD IS A LEADING MANUFACTURER AND EXPORTER OF GRAPHITE ELECTRODES IN INDIA. BUY HEG IF SUSTAINED ABOVE 1880 MORE ADD ON 1750/ 1700 & 1600 TGT 2000 & MORE

Motherson Sumi Wiring India LtdMotherson Sumi Wiring India Ltd
Friends MOTHERSON SUMI WIRING IND LTD. यह हमारे Chart Of The Week का ही Stock है जो काफी लंबे समय बाद Breakout पर खड़ा है । यह Stock काफी समय
Good Analysis
Mujhe bahut achha profit hua sir ji
Jhkash